
Page 23 - Studia Universitatis Hereditati, vol 13(2) (2025)
P. 23
uble residuum was calculated as the mass differ- alytics Laboratory (Miami). Due to the small
ence between the sample treated with HCl and number of dates, an age–depth model was not
the untreated mass of sediment. The amount of reconstructed. Ages are reported as calibrated
insoluble matter in the sediment was used as a ro- calendar years before the present (cal yr BP; pres-
bust measure of the noncarbonate mineral mat- ent =1950 CE).
ter in the sediment samples. The analytical pre-
cision of this method was controlled by repeated Optically Stimulated Luminescence Profiling and
measurements of the individual samples and the Dating (OSL-PD)
standard reference material, Soil NC Reference The OSL-PD method applied here employs a
Material (%N = 0.21 and %C = 2.29). two-stage approach to the luminescence inves-
tigation (Kinnaird et al. 2025; Srivastava et al.
14
Chronology C AMS (Osor Bay) 2023): in the first stage, the luminescence prop-
The chronology of the core OSOR 2 drilled in erties of the bulk sediment in the core was evalu- 23
vicinity of the town of Osor at a depth of 30 m ated using portable OSL equipment (Munyikwa
Dip Your Finger in the Sea...
was investigated through the AMS radiocarbon et al. 2020). A relative luminescence stratigraphy
14
dating method ( C). Dating was performed on was constructed and used to identify positions
three well-preserved mollusc shells. AMS radio- down-core for dating purposes. This was used to
carbon dating ( C) was performed at Beta An- identify the most promising positions in the core
14
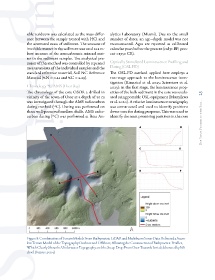
Figure 8: Combination of Terrain Models From Bathymetric LiDAR and Multibeam Sonar Data Delivered a Seam-
less Terrain Model of the Topography Onshore and Offshore, Allowing the Construction of Bathymetric Profiles,
Which Clearly Show the Underwater Topography and the Steep Drop From Osor Towards Istria (elaborated by Mi-
chael Doneus, 2024)