
Page 25 - Studia Universitatis Hereditati, vol 13(2) (2025)
P. 25
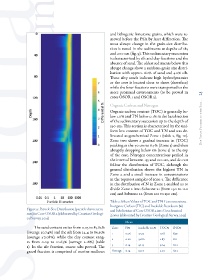
and lithogenic limestone grains, which were re-
                                                           moved before the PSA by laser diffraction. The
                                                           most abrupt change in the grain-size distribu-
                                                           tion is noted in the sediments at depths of 185
                                                           and 200 cm (fig. 9). This sedimentary succession
                                                           is characterized by silt and clay fractions and the
                                                           absence of sand. The oldest sediments below this
                                                           abrupt change show a uniform grain size distri-
                                                           bution with approx. 60% of sand and 40% silt.
                                                           These silty sands indicate high hydrodynamics
                                                           as the core is located close to shore (shoreface)
                                                           while the finer fractions were transported to the
                                                           more proximal environments (to be proved in     25
                                                           cores OSOR 1 and OSOR 3).

                                                           Organic Carbon and Nitrogen
                                                           Organic carbon content (TOC) is generally be-
                                                           low 1.0% and TN below 0.1% in the basal section
                                                           of the sedimentary succession up to the depth of   Dip Your Finger in the Sea...
                                                           190 cm. This section is characterised by the uni-
                                                           form low content of TOC and TN and was de-
                                                           lineated as geochemical Zone 1 (table 2, fig. 10).
                                                           Zone two shows a gradual increase in (TOC)
                                                           peaking at the 70 cm to 6.7% (Zone 3) and then
                                                           abruptly dropping below 3% (zone 3) to the top
                                                           of the core. Nitrogen concentrations peaked in
                                                           the interval between 155 and 100 cm, and do not
                                                           follow the distribution of TOC, although the
                                                           general distribution shows the highest TN in
                                                           Zone 2 and a small increase in concentrations
                                                           in the topmost samples of zone 3. The difference
                                                           in the distribution of N in Zone 2 enabled us to
                                                           divide Zone 2 into Subzone 21 (from 190 to 120
                                                           cm) and Subzone 22 (from 120 to 190 cm).

                                                           Table 2: Mean Values of TOC and TN Concentrations,
                                                           Inorganic Carbon (TIC) and Insoluble Residuum (%)
               Figure 9: Particle Size Distribution (particle diameter in   and Subdivision of Core OSOR 2 into Geochemical
               mm) in Core OSOR 2 (elaborated by Croatian Geologi-  Zones (elaborated by Croatian Geological Survey, 2025)
               cal Survey, 2025)
                                                                   Mean
                   The sand content varies from 0.03 to 85.62%   Zone  N%   insoluble res.%  TOC%   INC%
               (average 50.74%) and the silt from 14.4 to 89.35%   1  0.06  32.73    0.28   8.39
               (average 47.08%), while the clay content rang-  2   0.20   32.80      2.87   8.11
               es from 0.09 to 10.63% (average 2.18%) (table
               1). In the silt fraction, coarse silts prevail. The   3  0.14  30.13  3.04   8.22
               gravel fraction is comprised of marine molluscs   Average  0.14  32.17  2.02  8.23