
Page 24 - Studia Universitatis Hereditati, vol 13(2) (2025)
P. 24
for dating purposes, deemed to be either side of phology extends to the Istrian peninsula with
the terrestrial–marine boundary. very small variation between 49 and 52 m depth.
Its adaptability makes the OSL-PD method a The morphology to the south of Osor, which
highly valuable tool for dating discrete landscape marks the northernmost part of Lošinj Chan-
features and terrestrial and marine sediments re- nel, is a karstified extension of Cres and Lošinj
covered in cores. It provides sediment chronol- islands with submerged dolines filled with up to
ogies that can be used to interpret the environ- 10 m of marine and terrestrial sediments (Bru-
mental archives contained in soils. The method nović et al. 2019; 2020; 2024). The sea floor is a
was recently successfully tested in the karst land- gently inclined shallow shelf disturbed by dredg-
scape surrounding Osor, yielding a date range of ing to allow boat transport. Osor Bay and Lošinj
200 ± 100 AD for the municipal land survey of Channel are connected with a 2.6 m deep mod-
the Roman town (Doneus et al. 2024). ern channel.
24 Two cores were taken in March 2024 from
the Jaz Bay (fig. 1). While the HGI core (JAZ 2) Lithology and Sediment Texture
is still undergoing sediment analysis, the second The sediment sequence of OSOR 2 core ex-
studia universitatis hereditati, letnik 13 (2025), številka 2 / volume 13 (2025), number 2
core (JAZ 1) has been used for OSL-PD dating, hibits coarsening-upwards trend, with a
focusing on coastal changes outside Osor.
transition from coarse silt to sand at a depth
of 185 cm, with a slight fining upwards trend
Results at depths between 10 and 30 cm. Addition-
Osor Bay ally, the colour of the sediments changes
The Morphology of Osor Bay and the Lošinj abruptly from grey to dark brown (185 cm)
Channel and to a brownish grey at a depth of 70 cm.
For the needs of the current project, the ALB The sedimentary succession of OSOR 2 is
was fused with the multibeam sonar (MBES) composed of three sections based on colour
data. Analysis of the ALB- and multibeam-based variability (from the base of the core to 185
DTMs revealed a mean height difference of 5 cm cm, the dark brown section from 185 cm to
in the small overlapping areas. Nevertheless, this 70 cm and a grey-light brown section from
was sufficient to integrate the point clouds us- 70 to the core top). On a macroscopic scale,
ing the previously mentioned OPALS software, it is not possible to recognize a distinct layer-
creating a continuous relief extending from the ing, the core is homogenous in its structure.
shoreline to a depth of around 50 m below the The sediments can be predominantly classi-
sea level. fied as silty sand and sandy silt (Folk and Ward
The bathymetric data of Osor Bay shows 1957) (table 1). The mean particle sizes range
steep slopes down to 40 m, followed by a rela- from fine silt to coarse sand (4.5–575.6 mm). The
tively flat seafloor that gradually deepens to 50 m distribution of the particle size in the core sedi-
below sea level (fig. 8, profile C-D). This flat mor- ments is shown in table 1. and figure 8.
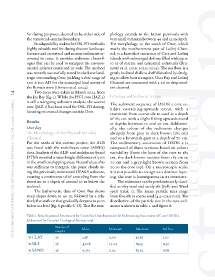
Table 1: Basic Statistical Parameters for Grain Size Distribution in the Sedimentary Succession of Core OSOR 2
(elaborated by Croatian Geological Survey, 2025)
Number of Mean Minimum Maximum Std.Dev.
samples
% CLAY 36 2.18 0.09 10.63 2.30
% SILT 36 47.08 14.04 89.35 15.56
% SAND 36 50.74 0.02 85.62 17.71